Accelo gives you tools to move more deals, making them quicker to close so that you can start doing the project work you love.
Visuals like dashboards on pipeline forecasting, the sales funnel, and team's win/loss rates can help spot areas of improvement overall, while list reports give individuals sharp focus on moving deals forward while keeping an eye on what has been done (such as the number of days since the last contact).
Using this guide, you can:
Sales Dashboard
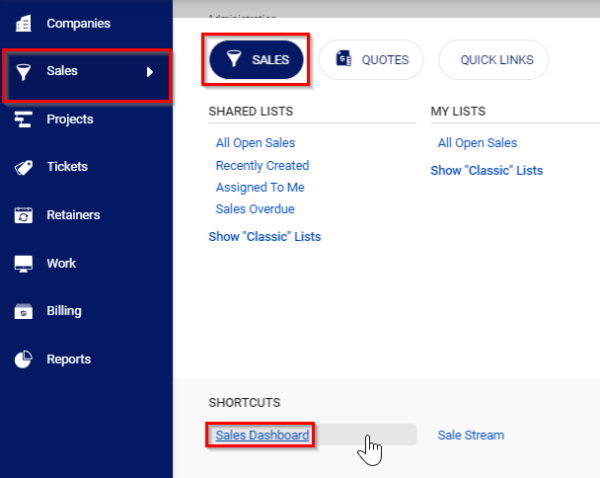
The Sales Dashboard can be found by from clicking Sales from the side bar and then selecting Sales Dashboard.
Your Sales Dashboard offers a convenient breakdown of your sales pipeline and income forecast, as well as a breakdown of each salesperson's individual performance.
-
Pipeline Forecast: The forecast uses the Pipeline Value (True Value x Progress %) of each of your sales to determine potential close amount each month based on the Due Date of each sale. Clicking a month's bar graph will present a list of all sales which make up that month's numbers, so that you can update those overdue sales.

-
Sales Funnel: A breakdown all of your active sales based on the percentage of the way they are through the overall process. That percentage will then be used to determine how much of those sales' potential Value has been progressed using the formula (Value*Progress %). Clicking one of the sections will allow you to drill down to a list of all sales which make up that number.

-
Performance: Here we'll break down each salesperson's numbers, detailing the volume of Won, Lost, and Open sales for the chosen time period, as well as the total value of those sales. Again, clicking one of these numbers will present you with a list of all sales which make up that number.
Sales List
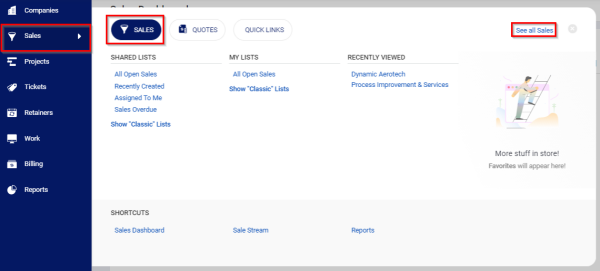
To get to the sales list, click the Sales from the side bar, then select an existing list or See all Sales.
Once viewing the list, you will first be presented with all of the sales your team has ever worked on.

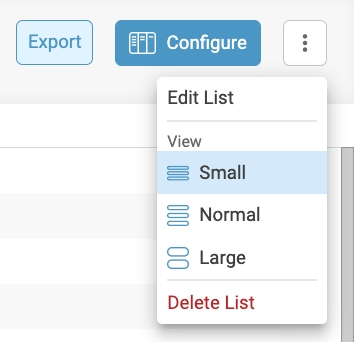
- Export: Click the Export button, and you will receive your current list in CSV format.

- Configure: This will pop up a window that will allow you to edit your Filters and Columns for your Custom List view.

- Edit List: This will display a list of options to change the standard view of your list from Large, Medium, and Small. This will also allow you to edit details of your current list view that is not Standard. More details on this in the Filters section. The additional option is to Delete the list.

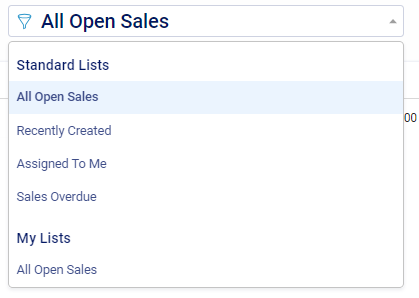
- List Options: A drop-down will appear for your current Custom Module List of all the Standard, Shared, and My List views.


