Reporting & Leadership
Focus areas in this session include: Forecasting upcoming work, scaling profitable work, and reporting outside of Accelo.
[Tom] Thank you, everyone for joining us for another episode at Accelo Best Practice Webinars. Today we're gonna be focusing on reporting and leadership. I'm your host, Tom. I'm an account manager here at Accelo, and that cheery fellow there is John. He's a solutions engineer here, who will be primarily presenting today's webinar.
I'm just gonna really quickly run through the agenda at a high level, before throwing it over to John.
So we've broken it up into a few different pieces here, beginning at the weekly level. Gonna cover looking at the weekly view of work, both looking forwards and backwards, as well as kinda taskboard assignee and the progress of ongoing work on a weekly basis.
Then moving through to the monthly piece. Looking at employee performance based on some of the in-app dashboards inside Accelo, as well as looking at company performance, setting up and exporting some reports around that as well. Particularly, including utilization, which also is a nice flow in to a team utilization and setting benchmarks and goals around team utilization on a monthly basis.
Then, moving through to quarterly. We're gonna look at setting up reports and exports both at a project's perspective and also a task performance perspective over the length of the quarter. Gonna really briefly touch on a couple of really cool triggers that are commonly used for some kind of in-app reporting and progress reports.
At the end we're gonna touch on a couple of bits and pieces that are upcoming within Accelo around improvements in reporting for the platform. Then, gonna leave plenty of time at the end for some Q & A. I'm gonna collate the questions as we go and we're gonna answer them all at the end. Anything that we can't get an answer to or, if we do happen to run out of time, more than happy to follow up with you after - certainly available.
Okay. So, I'm gonna throw this over to John and we're gonna get going.
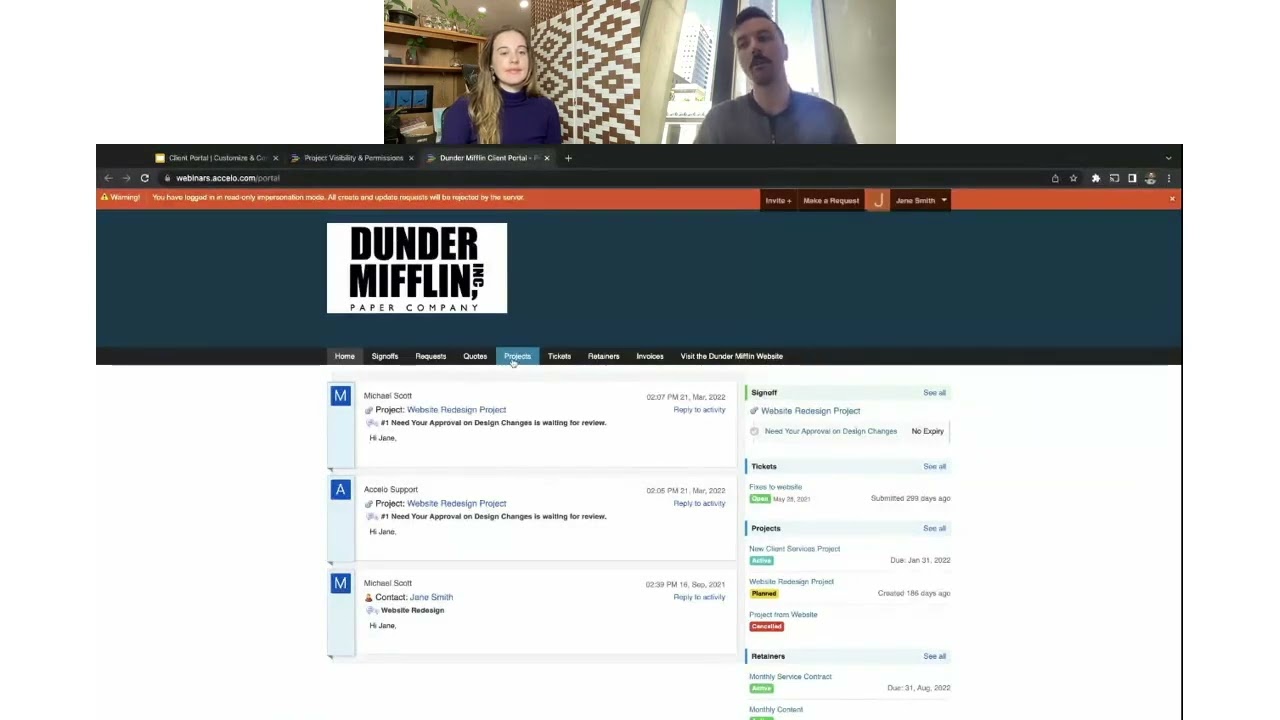
[John] Great. Thanks for the kick-off there, Tom. So, like Tom was mentioning, the start and the most micro-via that we'll be jumping in to today is weekly. A lot of what we wanted to cover today was something relatively new, the concepts not new, we've always had team scheduling, but some of the views that we'll be covering today are currently in testing and beta. So, if you're a valued, active customer of ours and have signed up for the beta or have been keeping in close contact with our blog, you may have already been able to find the views that we go through today. If you're a newer customer, or this is your first time hearing that there's a new view for scheduling, the way that you can access it, either as we go through today you can tag along, or after the call, is you would put your company name or whatever you have chosen to be before the dot Accelo dot com for your account name and then backslash, here for the scheduler grid view, the newer view of the team schedule that we'll dive in to today.
So, what I first wanted to jump in to is being able to quickly answer the question of what happened last week, and then we'll look a little bit forward if ... Let's say that this was a Monday morning meeting, and it's during our team stand-up and we wanted to see what is going to happen this week. We'll also be using that new team schedule view to view that. Then, one of our older views, and actually, oldest view on the taskboard for assignee to be able to see what's on everyone's plate for this week. Then, lastly we'll hop over to some of those higher velocity work items like tickets.
So, to kick it off, for what happened last week, let me hop over to the new scheduling view. So, what we'll be able to see here on the new schedule view, on the left hand side is everyone on my team in this demo account. And there's a few different ways to either segment your team or to pull-up your entire team. One would be adding users one at a time. So if I want to add C.J. or someone who's not here, I could just pull-up his name. Alternatively, and some of our customers have begun to create skills and groups to be able to categorize different skill sets. For example, the design skill set versus the development skill set. Or even groups, and this is commonly put in by the executive team or the project management team. Some of our customers are using groups for their different offices. So, my west coast team versus my east coast team and pull up the different groups and see how busy they are.
What we're gonna find here on the different heat map views is how busy everyone is. So if we were to ask the question or answer the question, what happened last week? What I would first want to do is pull-up the time that will show me what happened last week. So, we have two different categories of time on the schedule. One would be the past time or time that was actually logged. That would be billable and non-billable. So I definitely wanna see that. Then, we have four different types of future looking work and we'll cover those briefly in the next section.
So, from a really high level, what happened last time. Well, Tony wasn't that busy at all, he didn't log much time. Travis and Eddie were a lot busier. And it looks like C.J. was either on vacation or just didn't log any work. So, kicking it off, this gives me a good idea of probably who didn't fill out their time-sheet or not. But if I'm asking them not to fill out their time sheet if they're not doing any work, then it looks like a few of us weren't busy at all last week.
If I wanna drill down, let's say I wanted to check out what Eddie last week, all I have to do is click on the box area and then on the right hand side we'll be able to first see everything that he did last week. So, he did almost 30 hours. So, basically his whole entire week was installation for a new client, Hardman Communications. And if I wanted to piece together exactly what he did during that installation, I'm able to quickly drill. So, it looks like Eddie is pretty involved across the board. He helped with the kick-off. He put together the development of the plan, as a subject matter expert. Then, he worked on the implementation phase doing installations and tests. Looks like he spent about 15 hours over a few days on that too.
On top of the installation, it looks like Eddie did a few other things. He got pulled in on a sale, maybe he was helping us put together a proposal or a quote. Then he was either coming in as a subject matter expert, or maybe he's a technician on our team and he was working on a ticket. I'm able to see that here.
Now, if you're familiar with our older team scheduling view. You might be used to clicking in to each day and you still can get a good sense on what happened each day by clicking through Monday, Tuesday. Looks like he was exceptionally busy on Wednesday and Thursday, because we have little red squares that shows that he was over-booked or spent more than 8 hours each day on this. And then on Monday he didn't have any work. But, we're finding that the all view has been really helpful to answer, and quickly answer, that question of what happened last week for Eddie and others on our team. So, Travis helped Eddie with installation. Then, Allison is an account manager on monthly services and doing some tickets.
Now, if we wanted to start to ask the question of what's on everyone's plate this week, or looking out to next month. What I can do is, I can add the four different types of future work in here to be able to see how busy everyone is.
Just briefly going over what the difference between these are. Scheduled would be like if I had a client meeting or internal kick-off. These would be meetings that I booked from Accelo that are scheduled on our calendars, or coming from my external calendar if I just put a client meeting on Google calendar or my Office 365 Outlook calendar. All those scheduled meeting times we'd be able to come back in to Accelo and reflect on what is everyone doing this week, or how busy they are.
External, we found sometimes is helpful, sometimes isn't from a utilization perspective. This will be pulling in things like dentists appointments or lunch with a friend. Any external appointments that are on a calendar but not necessarily related back to a project or to client work.
Committed would be wanting to work on something specifically today for eight hours, or I want to work this week for four hours each day. Committed time allows me to pull some of that scheduled time off for a project on to people's calendars.
Then, auto-schedule, if you don't do anything like scheduling meetings or committing specific time, and you're just assigning people to tasks and projects, auto-scheduled is what automatically will show up on the schedule as things I need to do based off of start and due dates of tasks. This is more often than not, going to be the most common, or at least the biggest amount of time that's going to be showing up on the schedule.
So, here, what I can see is what's on everyone's plate. From a high-level heat map, it looks like Eddie is really busy. Almost double the amount of ... actually more, than double the amount of utilization that we're shooting for. Then John, myself, I'm a little overbooked as well and if I wanted to drill down and see what's on my plate. Most of the week, I'm working on a Banner Ad for an advertising project, and it looks like on top of that I got scheduled for a new installation and a consulting gig with Stanford that we just won. So these are one of the weeks that either I suck it up, have very long nights. Or, this may be something that I start looking at Tony and Travis, check their skills sets, and see if any of them can pull-off some of this work. And, I just drag and drop and shift it on to their calendars.
So those are the two different ways to answer what's on everyone's plate this week, if I was doing my Monday morning, and then looking back in to the previous week.
Now, during stand-up, a lot of the times, maybe your using a taskboard app or maybe you have a calendar up on the wall. So, some of our customers, shifting over in to Accelo and trying to use it as their source of shifts, have found a lot of value out of using taskboards.
So one of the helpful ones is, I wanna pull a taskboard, I wanna see unassigned, and pull it for my team, and then everything that's due this week. So, what's on everyone's plate: it looks like Ali is going through a Go-Live checklist and she's rolling off of a project, which is fantastic. Then, myself and Travis have a good amount of work that's due this week. Then, what I can take a look is for my team any unassigned work that needs to be done, like we're doing an initial creative review, maybe someone needs to work on that. Ali's definitely the least busy of stuff that's physically due this week. So, all I have to do is drag and drop it on to her calendar. Then, it's really easy to drag and drop and shift and move work around, as well.
So, this is slowly going in to, not necessarily just reporting on how busy people are, but being able to be actionable, and a team leader, and shift and move work around, and have conversations with your team using Accelo rather than using sticky notes or a whiteboard, which is usually the common thing to use outside of a system like this.
Then, the last one that we'll do weekly, and this can just as easily be a monthly task as well depending on how fast my tickets get created and completed. Same with projects, if I have a very quick project, maybe this is a weekly report that I do, is just getting a sense on how many tickets came in and how many were completed last week.
So, what I'm going to do is go to the list view to answer these questions. Any of these objects or modules on the left hand side will go to a list view for the module that it represents. So for example, if I wanted to pull a list report of all sales, I can go here. Since we're looking at tickets or services, all I have to do is pull up this and it automatically defaults to any active tickets in the pipeline.
Now, what I wanted to do is maybe take a look at what was open last week. The more filter here is going to give you more options to filter off of that's beyond just these defaults. Some presets are things like date and staff, but your also able to add custom profile fields or extension structures. So, for example, if you wanted to sort or filter by waiting reason, is it on the client or is it on us? You're able to do that from here, too.
Alright, so, opened and we wanna look at something that was opened on or after, let's say in the past week. So, it looks like these tickets are still opened, and if I wanted to save this report or share it with the rest of the team, what I'll be able to do is save this. And, no means it's just a personal report for mine, so this is really common in the ticket land for a technician, maybe he just wants to take a look at his own cue. Whereas, a support manager or owner on the team, might wanna share the report with the rest of the team, and have it as something that everyone's keeping their eye on. Like, what was closed last week or opened last week.
And then I'll be able to easily access those within each of the objects like tickets, on here in my filters and shared filters. Then, let's say that I didn't want to click in to that, I was in another screen. I'm able to really easily get back to these filters. You can think of these as, more or less, list reports here.
So those are the three things that can happen weekly. What we'll transition in to is what we can look at for monthly.
So, the first thing that we'll take a look on is easy ways to see employee performance. That would be, new business, looking at how are account managers are performing with sales. The technicians and who they're doing on the support side, using the ticket dashboard. And then, lastly we'll jump in to project managers and how they're tracking on budget or on time on the projects that they're managing.
So, to find the dashboards, on the top navigation, right next to the saved filters is the dashboards. What we'll be covering are the three different object dashboards here.
So, the first one, to be able to take a look at how are sales team and account managers are performing, is the sales dashboard. The top area are things like forecasts on what we're planning to bring in, and then the sales funnel, how many sales are in each stage within our pipeline. Maybe, these are discovery and initial conversation sales, whereas these are later stage, the quotes out, or we're in the final stage of the proposal being signed.
Then, if I wanted to start to answer the questions on well, how are my individual team members doing? How is Ali doing versus how is Richard performing? Here we can see the performance. And, if we're doing this monthly, I would probably just look at how did we do last month.
So, looks like we currently have two won sales for Ali, so she's definitely our top performer on the team. Then, Travis has one sale that he lost, and no one else lost a sale. So, what we can do from here on the dashboard is ... it's really easy to get a sense on what the sales are behind these numbers. Basically, everything on any of our dashboards is really easily linkable. So, for example, if I wanted to get a sense on, well, what did we win? All I have to do is click here. And if I wanted to have my one-on-one monthly meeting with Travis and sit down and go through his win/loss, all I have to do is click on this lost and we can go through a long trail of meetings that he's had because Accelo integrates with your email. It's been really helpful to do a postmortem on the lost sales, on where do we think that we lost them? Was it after the quote? Was it on the initial scoping phase? So we'll be able to read those back and forth. So that's been really enlightening rather than just reporting, but actually drilling in to see the mechanics and what happened in the process.
So, moving on from sales, and going in to the projects land. The top level project dashboard has a band of KPIs and these are more for the finance team or even the executive team to get a sense on what was done, and what have we not improved ... or approved on the work side if we're doing time and materials invoicing. If we were to scroll down, the project score card allows me to see, are we tracking things on budget or are we slipping? Are we hitting our due dates or are they falling behind? And then on the activities side, we're integrating both the time logging and emailer meeting activity. So, even if we're not doing large chunks of work, but we're having client conversations, that's going to still show as green. So this will give me a sense on what's actively working on versus what's starting to become dead.
Now, if I wanted to drill in to the performance by person, I can do it here. So, if I wanted to see how Travis is managing his projects versus how Tony's doing. Travis is slipping a little, but actively working on it. Let's see, and then on the performance side, if we were to look at the different project managers, again this would be a roll up of all of Travis's projects versus how Eddie's performing and how Richard's doing. So, in this case, Richard and Eddie are performing relatively on time, rather than Travis who's lagging. And Richard, by far, is keeping things on budget versus Eddie who's slipping a little, then Travis who's not doing a great job of keeping their project on budget.
Again, these numbers help me give a sense on how the conversation should be when I'm having my one-on-one with the project managers. But, more importantly, it's just not a report, it's really easy to get the answers to the projects down below. So, we'll have full project plans with activity streams and will give both of you a good sense to sit down and look through the project together.
Then, the last dashboard that I want to cover is on the services or the tickets side. So, what we can see here with the staff performance, again, in the past 30 days, is how each of my staff is performing.
So, Ali's definitely our top performer on the team. She's opened five, she's resolved seven. She's probably picked up a few, so it's actually over 100% resolve rate.
Then we go in to average age and average time spent. So, the average age will tell me the time between open and close, and how long it took, how many days. So, Ali is definitely doing the best out of the team versus Eddie and John. Then, the average time spent would be: how many phone calls, meetings back and forth, people needing to escalate internally, and all their time logged, does it take to close a ticket. We're usually looking for a lower average age and a lower average time spent on support tickets, at least. That indicates better turn-around time, hopefully happier customers, and less of them using the services and tickets for doing ad hoc or smaller work. Then, I would probably have to drill one level lower to get a better sense on what these KPIs mean to my team specifically.
Excuse me, just one moment.
So moving on to the company performance side. Probably the biggest thing for monthly that we wanted to look at is last month forecast versus the actual utilization of last month. So, what we'll first take a look at is how we get the data out of the system. Then I'll show you the spreadsheet that some of our customers are using to be able to compare the plan versus actuals.
What you'll find on the utilization dashboard is actually very similar to the data that we're representing on the team scheduling side. And likely, from the team schedule, in the future, we'll be able to export similar to here as well.
So, let's say that it's the very end of July or the very beginning of August and I wanted to pull a report for all the forecasted work or what August is looking like. So, what I would do at that time is I would use the date range, and I wanna take a look between August first and August thirty-first. So, what that'll do is it'll pull all the forecast data, if you recall we're in the end of July, so right now on the count it's all actual data, but it would probably be a lot of purple and a lot of blue for estimated time in to the future, and then, I would export that.
So that would be my first snap shot of the dataset of what August looked like from July. Then, what I would do on the first day of September or the very end of August is I would pull another report, using the same date range, August first to August thirty-first for 31 days. Then I would export what the actuals were, what the billable versus non-billable were in August. Then, where the real insights come from, at least from the snapshot and the perspective that we're looking at for this report, is comparing, what did I think August was going to be, based off of all the plans or all the projects that I had just recently sold and put on everyone's plate, and then what actually happened. Were there slips in the projects? Were there things that were unexpected that changed? Maybe an employee left. So, this is going to help me understand the variance in my planning so that I can better forecast in the future.
So, the first dataset that comes out on August first, or the end of July, will look something like this. It will show everyone's total availability for the month of August. There won't be any actual billable percents or any time logged, because August doesn't exist yet. Then, we'll see the four different types of work scheduled into the future sitting here.
What I found useful is to add two other columns to this for analysis. One would be, just a simple roll-up of the four different forecasted hour types. And then, just a rough estimate of what my total forecast looks like.
Then, at the very end of August, the beginning of September, when I pull the actuals, I don't have to do any data manipulation. All the forecasted times should be mostly cleared out, unless if I forgot to log time on a meeting or probably not logging time on a dentist appointment. Then, we can start seeing the actuals coming, looking back in to August. The billable percents and the time that was actually logged.
So, moving to the third tab. What we can do is we sum up, for example, Tony and all of his planned hours, and all of Tony's actual hours. Then, what I'm interested is in the delta, between the planned versus the actual, so just minusing one column in the other.
So, in this case, the actual was higher than the planned, so our plan was in negative. This variance isn't that big of a deal, three hours here or four hours there, that's not too big of a deal. What I'm really looking for is the big swing in variances, like the way under planning of Eddie and the way over planning of Robert. So this will allow me to jump in to see specifically within the things that they're assigned to and the projects, what happened? Was it a client, in this case, who delayed and we thought Robert was going to be working more and earning more value towards the project, but ended up not? And in this case, was Eddie thrown on something at the last minute? Was he picking up a lot of tickets? All the small little mechanics that can go in to the variances on utilization.
Variances aren't necessarily bad. Maybe we're putting more on their plate because they were totally underbooked coming in to month, and they did a lot of valuable client work. But, what we're looking for is how we can operationalize and systematize the assigning out and our resources so that we can more confidently bring in new business, make hiring decisions. It tends to trend towards less variance being a lot easier to actively plan and be more confident looking in to the future quarters.
Then, the last thing that we will likely do monthly is do a live forecast of the next month. So, this forecast that we saw here on August planned in the number form works really well. And while we're looking at those numbers, hopping over to the team schedule and looking out in to the next month has been really helpful, too.
So in this case, if we were looking out in to the next month or so, it looks like we're relatively booked. It looks like Travis has a bit of a lull here. He might be rolling off of one project and rolling on to another. If I wanted that answer, I could just drill down in to it. It looks like Eddie is really slammed here, so we might have to push the project out a little bit more here, to accommodate his schedule or find someone else to work on it. Then, Ali doesn't have anything. So if we're working with a new business team and thinking about when we can start slotting larger projects on, probably the end of September if it's a one man thing. Or even C.J., we might be able to put his time up on to Eddie and then have Ali and C.J. be the two leads on a future client project.
So, these sort of conversations that I'm having with my self now, I'm likely having with the rest of my team and we're talking with new business, and the project management, and the traffic management, and the executive level. We're all trying to play Tetris, essentially, with the work that's coming through and what we can do so that our team is productive and we can bring in more work, more revenue, happy customers, whatever your goal may be. This view has been really helpful to visualize that.
So, that's heat mapping on the team's schedule. What we can also do is, do sort of a different heat map, when we think about stacking up all the projects that are coming through the pipeline.
So, here in the work schedule, what I've done is I've pulled a list of all my active and scheduled or committed projects. I could just as easily add to this all of our planned projects, as well. What we can start visualizing is how are projects are coming through the pipeline. So, let me just drag this to the bottom. So we can start stacking and seeing, for the projects. Well, we're actively, as a team working on about four right now. Strategy and implementation can move up. And as we're moving in to October, we're bringing on a few more and this is just a double back up of what we had witnessed before, with Ali and C.J. not having any work and the late September, early October. It looks like most of our projects are ending, so this is, again, another case of pulling in more work and figuring out where to slot that in to my portfolio of projects here.
Moving on to quarterly. There's two large things that we can pull from Accelo to start getting more insight in to our operations. And, both of these are done outside of Accelo. So, the first is profitability. While we can report on profit, and I'll show you where you can see that within Accelo. If we wanted to do a global projects profit analysis across all of our projects and start comparing types, we'll show you how to do that. Then, secondly, on task performance, how the different individuals on our team are performing on the different tasks that are given to them, and trying to figure out and find what are core competencies are within the organization. The task performance analysis has been very helpful for that.
So, first on the projects profitability, what I'll show is how to set up the list report and export to get that data out of the system. So, similar to what I did for the tickets, I'm going to want to pull a list of all of my completed projects. And since we're doing this quarterly, maybe I want to see everything that was completed last quarter. So, if I was doing the first of the month, I might jot down 90 here. Otherwise, I might but a specific date range. Then, from here, what we'll do is we want to export.
The difference between simple and extended exports within these list views is: simple will be basically just what I'm seeing here, it'll be things like title of the project, the project manager, the amount of budget that was used. What extended does is it pulls in all of the custom fields that you have, so if you have special things like the platforms that we implemented them on, or the specific region, or business unit that we're implementing with if you're working with a chain, for example. The extended would be very helpful, because it would allow you to drill one step further on the project profitability.
So, now, shifting over to the raw data that's coming out of the system. What Accleo is going to do is, because as I was mentioning before, different project types might have different custom fields. We're going to tab out the different project types. So, the first step in aggregating the raw data, is to combine the dataset and then, what I like to do is put type as a column, and then put the different types of the projects as different data points. So, website design, in this case, versus implementation.
Then, some other items that I like to add is, it's now pulling the services, price, budget, cost, profit, as well as the materials. But, for large level analysis, I do like to pull in total revenue, total cost, and total profit so I can get a sense on the total profit margin on this spreadsheet.
And, if these data points look familiar, it's because, within each of these projects, we have all this information sitting there. So, for example, if we were to hop over to that web-build, maybe we're designing a website. The project overview will have some of this information, like the total budget used and the total hours. Then insights are gonna get very close to that Excel printout. So, here under financials, you'll be able to see the services budget versus the material budget. These are the majority of the columns that we'll be using for this calculation. So this is, again, all under the insights tab within a given project.
So now that we have all the raw data out, what I want to do is some profitability analysis. A common one that we hear is just comparing the types. I wanna see how we're performing in website design versus our implementation projects. So, what I've done here, and you can easily use a pivot table for this in Google Sheets. Pivot tables aren't fantastic, so we end up using countif's and sumif's to figure out this information. My main goal in this analysis is just to figure out some KPIs or ratios, like the profit that I bring in per project. Website designs bringing in about double the profit that my implementations are doing. The total effort in hours roll up. It's taking about double the amount of time of the hours for website design as implementation.
Then, some unit economics, like for every hour that my team spends in a project, how much profit is coming from the client on this. So, in this case, this is actually a really good sign, meaning that we have a pretty similar value for each of these. It's 460, about 450 for website design. Which means, for every hour that a consultant, or designer, or developer puts in to a website design, we can expect to get about 450 dollars. Eventually checking out, after everyone's been paid off, overhead, any overages, or unexpected things that come in to that. Same goes for implementation.
Now, let's say that website design was sitting around 200 dollars of profit per hour. That might be an indication of a few things that I would want to drill in to more. One of those being, website design, the process maybe isn't totally flushed out, so we need to get better at the process and put less time in to that. Or, website design isn't as valuable as it used to be 10, 20 years ago when we started it and now the new thing that gets the most money within our space is doing implementations of ERPs and PSA system, and that's the strategy that we should direct towards. So, those are some of the insights that we can get from doing something like this.
Next would be drilling one step lower and looking across all the different tasks and finding out how the team is performing on their different skill sets.
So, first to do this analysis, we would want to get a export of all the tasks from the system. We can do that by going to the tasks and show all tasks, and just like the projects that we pulled, we'll likely only want to pull tasks that have been completed. Then, completed within a certain range, like last quarter. Then, very similar to projects, what I wanna do is export this out, and there's only one option for tasks, and that's simple, so pretty easy to do that. Then, one last thing before we hop in to the spreadsheets is the use of skills. And, we'll be using skills to be able to compare things like a design task versus a development task.
So, most of our customers are putting skills on a template and what that allows you to do is, every time you create a new project, you don't have to think about marking it as a skill set versus coming in later on the task and putting in a skill set. So, for example, if I were to hop in to one of these, you'll find here, within each of the task cards in the bottom left hand corner is the skill. So, looks like, in this case, we had put the skill design in probably as a template. But, if I wanted to on the fly, add anything for the analysis, or maybe put a tag, like this task is on hold. Both these items will eventually sync over to the Excel spreadsheet.
So, let's take a look at what that raw data would look like. So, here's what that export looks ... It's including things like status, the start and due dates, who it was assigned to. And then, moving right. This is where I find a lot of value is around the billable time and then eventually the skills.
So, for me, what I like to add is at least two columns. One is total time logged, which simply adds up billable and non-billable time. So, even if it's not billable, maybe I'm having a internal conversation with a person on my team, I still wanna keep track of that, because it gives me a better idea on how long these are taking. Then, a simple calculation if it was over or under that initial budget.
So the first analysis that we can do with the pivot table, putting the rows as the different skill sets and then summing up the over or underage. If we take a look at the graph, we start getting some insights about the type of work that we're doing.
So, here, in this case, Adwords is consistently way over budget. Last quarter we went 82 hours over budget on Adwords. Versus, my Xero, and Quickbooks work, came in under budget and my training work came in slightly over budget.
So, I'm probably going to have to dig in to more details here and talk with people on the team and skim through the projects. But, from a high level, it's telling me a few things.
On the Adwords side, it might be telling me that we just started Adwords last quarter and we're new at it. And, we're spending a lot of time internally training the team and figuring out things with clients, learning Adwords and the Google ecosystem while we go through it, and that's why we're going way over budget on all these tasks. Because, not very many people are good at it.
Or, it might be something where we're significantly undervaluing the amount of time that goes in to these. It's a recurring task that we do on a retainer every month. And, when we started it a year ago we thought it was going to take x amount of time, and over the past quarter or year we found that it's going way over what we originally estimated. So, this might be a good time to go back and change those, and even go back to the client and saying, "You know what, we're spending a lot more time, but can you see the value of the time that we're spending?" And start changing some of those contracts. Or, just as easily, going to new customers who are coming on board and changing your scope of work, and your estimates before you send them out.
Then, on this side, maybe we're doing really good at training. And this is our core competency, to get no customers on to Xero and Quickbooks and train them on that. And this is what we're great at and this is what we'll continue doing a good job of, and this data would help back up those gut feelings that we might have.
The next screen digs in one step further, instead of just looking at the categories in which the team is performing well, or not performing well. I'm interested in the people on the team and how they're performing and maybe the skills that they need to be trained on. Or, maybe they're not good at something and we just stop giving work to them all together.
So, in this case, we're looking at Ali and she's coming in pretty good on the design front, not as good on the Adwords. On the development side, maybe she's a junior developer, and it's just taking her way more time than the other people on our team to do the development. This percent might be okay, or if she's been doing it for three years, with not much success, maybe it's time to move her off of that sort of work, and have her focus on what she's really good at.
Then, same goes for me. I'm apparently very good at Adwords, and not as good as design in this data. Again, maybe I focus more on Adwords, I get moved as an account manager on all my retainers and I stop doing all the website design work for new customers.
So, this data will help, definitely help managers sit down and better assess the team's skill. Then, also, have a conversation with them and ask them what they're good at, what they're feeling and how much time things are taking, and if it's frustrating for one or the other.
Secondly, this also may go back to who we're staffing on given projects, and who's working well with each other. So, there's a lot of hidden data behind this that, probably, would need a sit down around table and figure out together.
So those are the two items that I would ... or I wanted to look at Quarterly. There's a lot more that you can do with Accelo for the governance side and the high level quarterly tasks. But, project profitability and task performance have been the two most interesting ones that we've uncovered working with clients.
Then, instead of going in weekly, monthly or quarterly to pull reports and do the analysis. What we can do, is we can set up triggers when they're needed. What's really powerful about triggers is, you can think of it as a really smart manager who's coming in every five seconds, or ten minutes and keeping his or her eye on the work that you're doing.
So, a very common one is to do forecasted profit margin, if it slips below a certain level, give an alert. And then the other is retainer burn rate. If a client is using their hours too fast within a given period, then notify them.
So, what I'll do is I'll show you the basic structure to set one on a project, and it's more or less very similar to do it on the retainer side. So, triggers are found through the configuration and each individual project type can have a different trigger. So, profit margin below 30%, and this is forecasted not active. So, let's say that there's an internal change, and we had a lot more time on a project, or maybe the client's not getting back to us and there's some changes that we need to make and the profit margin just dipped down. Or, maybe we put a really expensive resource on the project to finish it on time. Those are some of the things that can allow this to go or slip under our intended margin.
So, anytime we're doing financial analysis, like profit, it would be under the finance drop-down. We want to say, when profit margin is less than 30%. So, if the forecasted profit margin slips below 30%, then we want to do something. Most of the times, we're just wanting to create an internal activity, especially to the project manager. Then, we might hard code the VP of Operations or the Head of Professional Service, even the CEO as a recipient of this. This will come as an internal note, and will show up as an email in their inbox as well. So, you can customize whatever you want to put in this alert. Often, I would want to have the link to the project, and maybe some more indications on what's going on there.
So, that's how you set up a trigger there. And, like I was saying, the retainer side is fairly similar. If the retainer falls below a certain percent, then notify internal teams or perhaps the client.
So, those are the four different categories that we currently have now. And along side using Google Sheets, for some deeper level analysis. What we've been working on a lot, these past few months, is looking how to extend reporting. There are two leading platforms that we're currently working with, and we're likely going to go live with both of them. So, one of those is Power BI. We've seen a lot of good progress on Power BI. And a lot of the professional service world, moving to Office 365 as a solid option to run their business operations. Power BI comes free with Office 365, so we thought it would be a really good opportunity to integrate with it. So, we've done some initial testing, and this is actually a screen shot from some of our initial testing. What's really powerful about this is, we'll start to be able to fill-in some gaps that we currently have. So, doing that profit analysis, or doing the task performance analysis, we've been able to do. As well as things like financial forecasting.
Then, on the GROW side, the main intention for GROW would be having standardized KPIs through-out your entire organization and share things, like how many new customers did we bring in last year? Or, what's our current sales pipeline? Or, how's our project revenue in the last quarter? To answer those, and to have that more open and available to the rest of the team, rather than stuck in some spreadsheets. We see GROW as being another really great option for that.
So, stay tuned on any updates. I believe we've already mentioned, in our blog, around Power BI and hopefully it's coming out this fall. Then, on the GROW side, we've just started testing it more seriously.